
How the test works
Search engine crawlers are also randomly shown a variant. This is intentional and prevents cloaking, that is, serving different content to the crawler than to the visitor. These page views are not counted, so the results remain unaffected.
Because the shop counts per session and not per page view, the statistics measure visitors, not page views. A visitor who views the page five times appears once.
Rules for planning
- Always test just one feature in different variants, never several at the same time. Otherwise, at the end you will not know which change had an effect.
- Expect at least 200 measurements per test case and subshop, preferably more than 1,000. Statistics based on thin data are not a basis for decisions.
- Plan the test completely before you start it.
Creating a test
In the online service area, select your shop ID, then the “A/B-Test” service and there “Neuen A/B-Test anlegen” (create new A/B test).Step 1: Basic settings
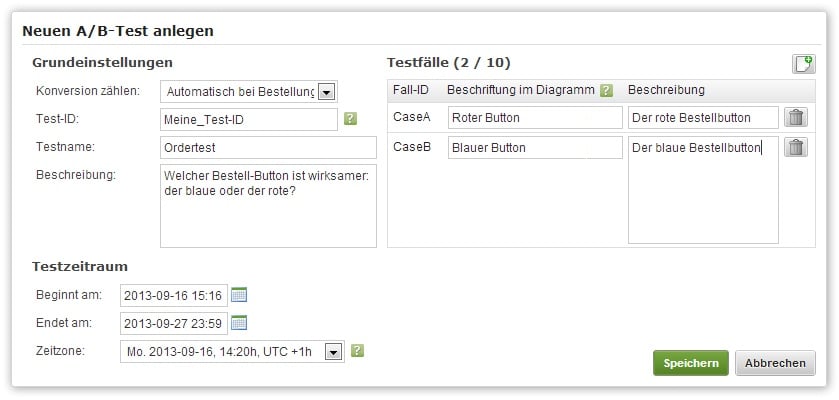
A test only counts what you have set here. A test with a target page does not count orders, and a test with orders does not count page views.
Step 2: Test period
Set the start and end using the calendar icons, and select the shop’s time zone.The time zone determines not only the start and end, but also the day boundary of the daily charts in the evaluation.
Step 3: Test cases
Use the document icon next to “Testfälle” (test cases) to create one row per test case. Each row gets a label and a description.Keep the labels short. They later appear on the axes and in the legends of the charts, where long text becomes unreadable.
Adding the test cases to the template
Two main sections are created in the template of the affected page. The first encloses the variants and is only output during the test period; the second contains the version for the time before and after.Setting the conversion counter
If you selected “Automatisch bei Bestellung” as the goal, there is nothing else to do. The counter increases as soon as a visitor reaches the order confirmation after going through a test case. With “Durch Tag auf Zielseite”, you set the counter yourself, at the point in the target page’s template whose reaching should count as a success.The evaluation distinguishes two figures: how many sessions reached the goal, and how often it was triggered in total. If a visitor calls up the target page three times, the first figure counts once and the second three times.
Checking the test cases
So that you do not have to rely on chance when you want to view all variants, there is a dedicated test mode. For this, the shop must be in the general test mode.Reading the evaluation
In the “A/B-Test” service, the bar chart icon at the end of the test row leads to the statistics. They are available during the test period as soon as the first measurements are in.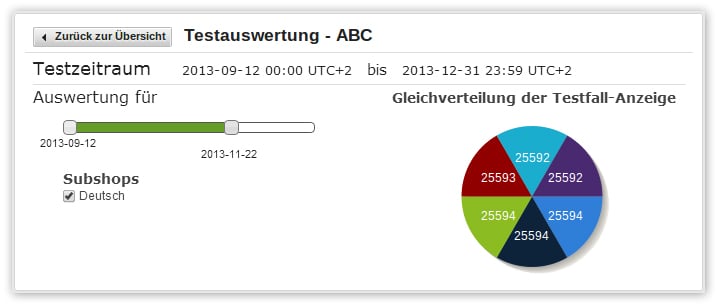
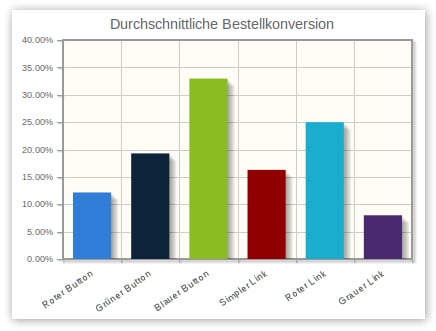
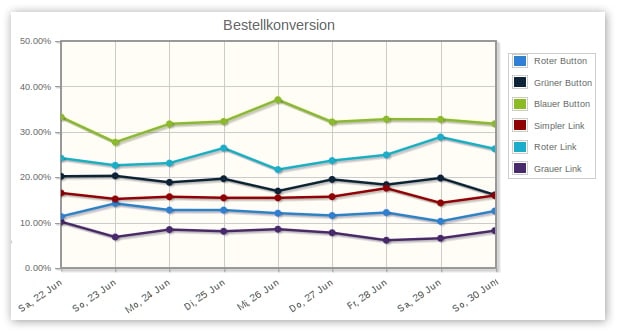
All four sections have the same structure: a bar chart with the average per test case and a line chart with the daily values.
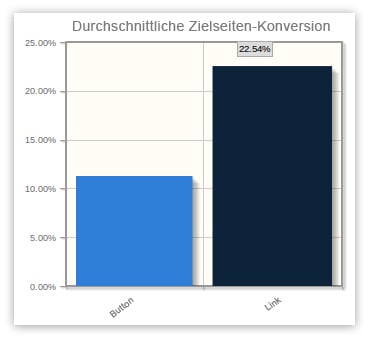
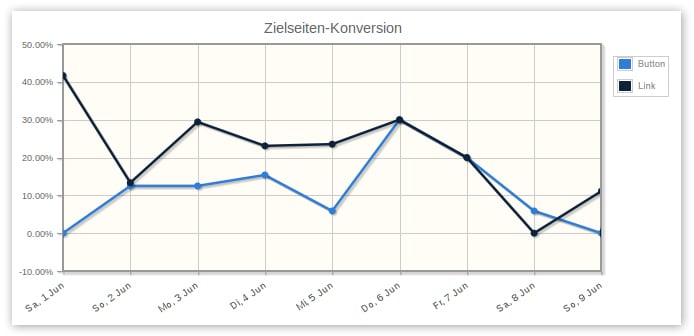
Looking at conversion alone is misleading. A variant can lead to orders more often while producing smaller baskets. That is why revenue, line items and products are shown alongside it with equal weight.
Related topics
- Guide: Switching the shop’s test modes on and off
- Guide: Integrating tracking